
Patterns are created by individual candles and the differences (or similarity) in multiple sticks in succession. These give you important clues about how the majority of relevant investors feel toward that particular investment vehicle. Prices tend to follow the opinions of the crowd. These sentiments can change drastically over a short period as relevant news is released. Candlestick chart patterns are a graphical indication of investor sentiment and the publicly known information about the investment over a given time frame.
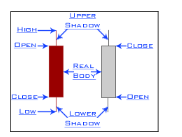
Candle explanation
There are many types of candle stick patterns based on the number of candles and trend. Some of them include - Hammer (1 candle), Bullish Engulfing (2 Candles), Three Black Crows (3 Candles) etc.
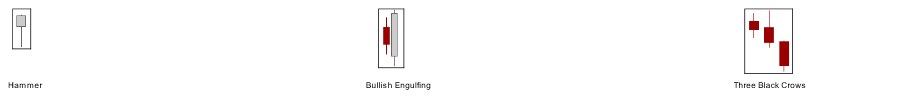
Various candlestick patterns
|
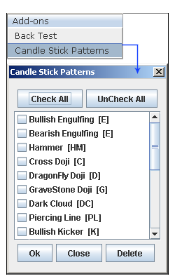
Candlestick patterns |
Tickerplant Chart offers you the detection of these patterns with the most simple, user friendly graphics and user interface where one can build a list of selected patterns of their choice and then apply them for desired output.
|
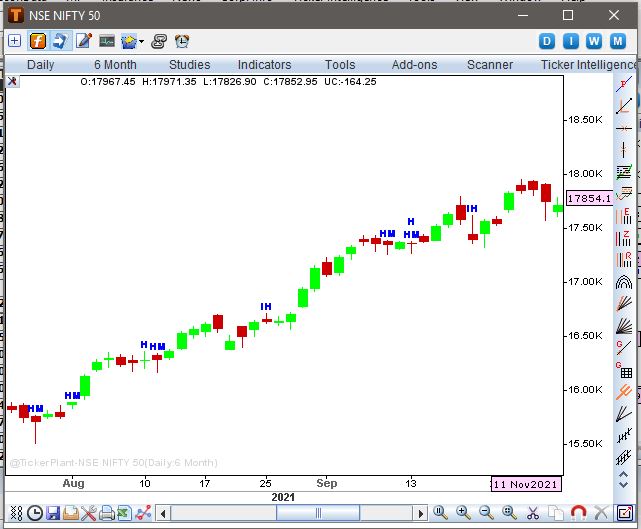
Candlestick patterns detected
Comments
0 comments
Please sign in to leave a comment.