
Selecting Chart Type
Tickerplant Chart allows the user to plot various types of chart like:
-
Line
-
Bar
-
Candlestick
-
Smoothened Candle Stick
-
Point
-
Histogram
-
Mountain
This can be done by a right click on the required chart as displayed. Below is the image displaying the various available chart types.
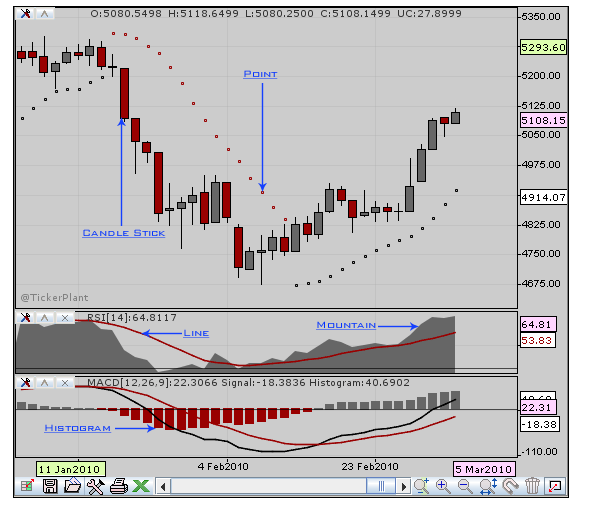
Different chart types
Selecting Required Data
|
Data selection menu |
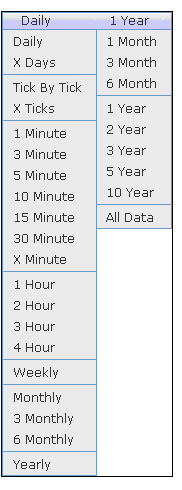
Tickerplant Chart allows the user to plot the data for the required choice of interval/period (Daily, Weekly, Tick By Tick, Minutes, Hourly, Monthly, Quarterly, Half-Yearly, etc...) through the drop down menu in menu bar. As displayed on the left, the combination of these two menus will display the required data in chart form.
|
Comments
0 comments
Please sign in to leave a comment.