
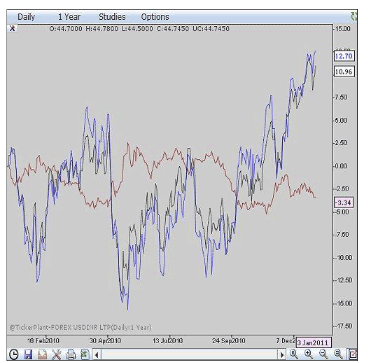
Want to compare two or more different stocks, indices, or mutual funds? Our Interactive Performance Chart is just the ticket. Performance Chart displays price performance lines for multiple financial data sets. Depending on the data sets that are used, these charts are great for tracking relative performance, sector rotation, inter market linkages and more. This allows user to view intraday, daily, weekly, monthly, yearly performance quickly and easily.
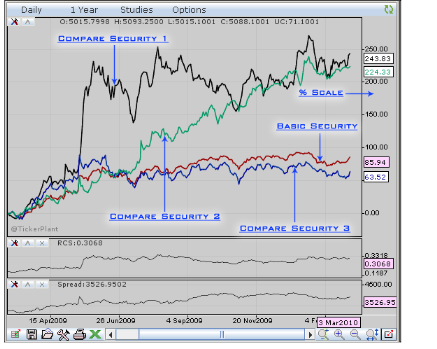
Comparison of four data sets on relative scale
In this you can also refer the Relative Comparative Strength and Spread of two particular securities for efficient comparison and analysis.
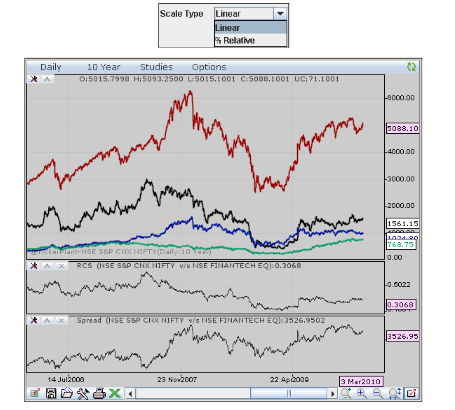
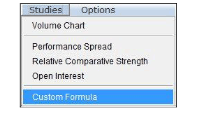
Studies menu in performance chart
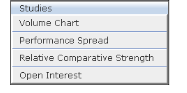
Tickerplant Chart / Performance Chart provide user the facility to compare the securities on the Relative Percentage Scale or Linear Scale. The required scale can be set through the settings selection under options menu.
Various scales options and data sets drawn with linear scale
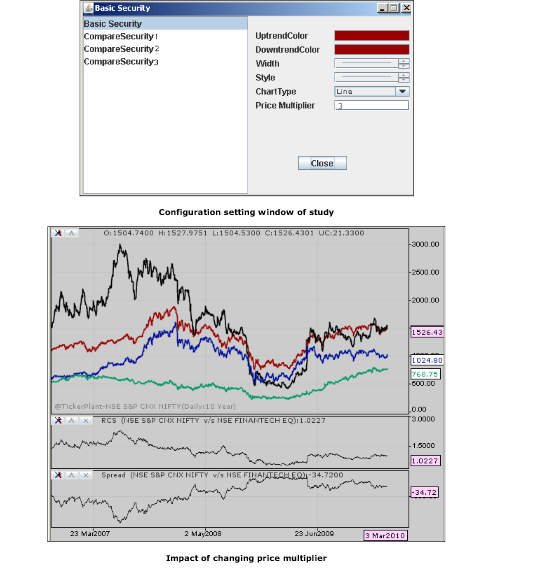
It gives flexibility to users to compare various securities with different multiplication factor for parity calculation, arbitrage opportunity, intra-markets, hedging and more.
Custom Formula
The custom formula feature available in performance chart enables the user to plot the output based on a custom calculation. For instance, the difference in crude oil contract trading on NYMEX and MCX can be computed and plotted in real time.
The custom formula feature enables the user to compare the performance of the selected securities (symbols) and simultaneously plot and refer the computed spread based on those securities
To plot the difference in crude oil contract trading on NYMEX and MCX, the user needs to select the required contracts in the performance chart window as above. In this case the user selects the NYMEX crude oil, Forex USDINR and MCX crude oil contract
Menu
Once the required contracts are added to the performance chart window, the custom formula can be built based on the selected contracts. To build the formula select ‘Custom Formula’ from the ‘Studies’ menu
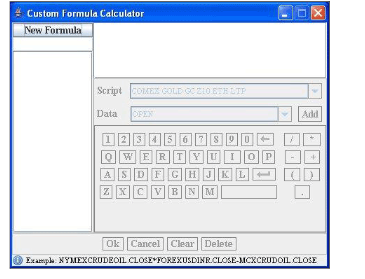
Custom Formula Calculator
The custom formula calculator is now available with the contracts required to build the formula
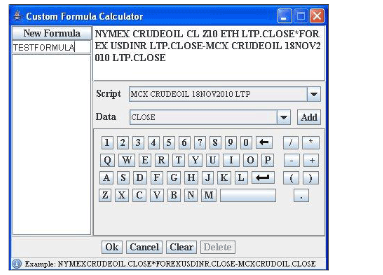
Added Custom Formula to Calculator
On click of the tab ‘New Formula’ user can start building the required formula. The contracts can be added with the appropriate selections in the script and data dropdown options as seen above. The user has the flexibility to utilize either Open, High, Low or Close prices in the computation.
The formula can be built as seen in the above image making use of the operators
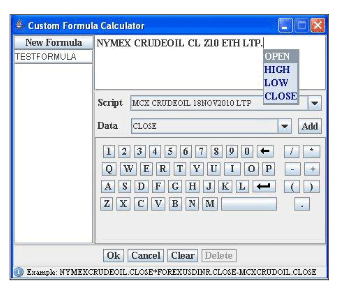
Alternately, user can also type the starting letter of the selected contracts say ‘N’ for NYMEX and the contract will be added for the calculation purpose. Further, user can add a dot (. ) and select whether the Open, High, Low or Close price need to be considered along with the required operators
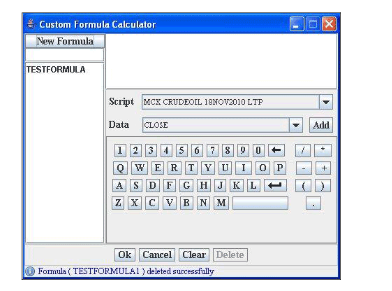
Once the required formula is built, provide an appropriate name for the formula and click Ok.
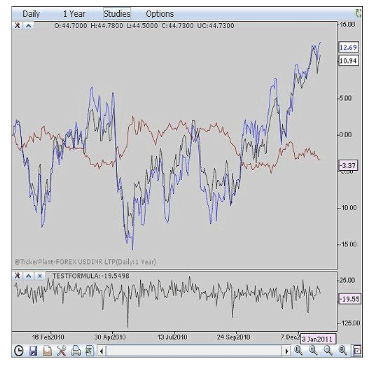
The output for the custom formula built is seen plotted in the chart window and identified with the name provided i.e. TESTFORMULA in the above example
Comments
0 comments
Please sign in to leave a comment.