
Custom chart enables the user to plot the output of a custom formula and apply the required tools, studies and indicators for analysis purpose
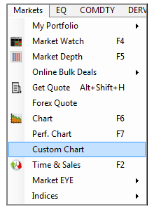
Select Custom Chart from menu bar
The custom chart option can be selected through the Markets menu
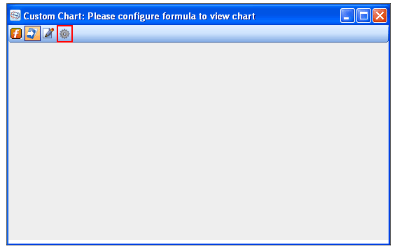
Custom Chart Window
The required contracts based on which the custom chart is to be generated need to be added to the custom chart window. Once the contracts are added, click on the ‘configure formula’ tab to build the formula.
For instance, the user needs to compute the parity existing between the crude oil contracts trading on the NYMEX and MCX exchanges. Accordingly, user accesses the custom chart feature and adds the required contracts through Quick Watch or drag and drop. Note that the added contracts will be seen listed only on click of the ‘configure formula’ tab.
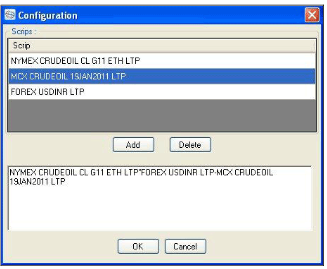
Configuration Window
The added contracts are seen in the above image when the ‘configure formula’ tab available on the custom chart window is selected .The formula is built making use of the selected contracts and operators as displayed
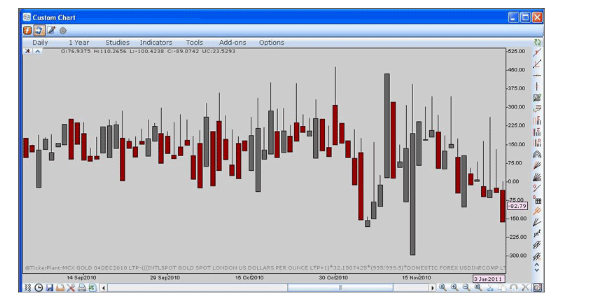
Custom Chart Displayed
Once the formula is set, click OK to view the required custom chart.
Comments
0 comments
Please sign in to leave a comment.